Mode is a measure of central tendency of a set of values of a variable and is defined to be that value of the variable which occurs with maximum frequency.
It is the most frequent value of the variable in its distribution and represents the true character of the distribution as a measure of central tendency.
In the language of Craxton and Cowden, “The mode of a distribution is the value at the point around which the items tend to be most heavily concentrated. It may be regarded as the most typical of a series of values.
” Thus the statement “the average size of shoes for a group of men in the age group 25-30 is 7” means that the size of shoes which fits the maximum number of men in the age group 25-30 is 7 i.e., the modal size of shoes in that age group is 7.
It is always possible to calculate the value of mean or median of a given distribution. But the mode of a given distribution may or may not exist.
For example, the mode of the set of observations 2,3,4,5,3,6,4,2,4,7 is 4 but the mode of the distribution 1,2,3,4,5,6,7,8 does not exist. In fact, mode does not exist when each value of the variable in a distribution occurs with equal frequency.
Again, mode of a set of observations may not be unique like mean or median. For example, the mode of the set of observations 1,3,2,6,5,3,4,3,5,3,2 is 3 because 3 occurs the maximum number of times;
but the set of observations 3,4,6,5,4,7,3,2,8,4,1,3,4,5,3 possesses two modes viz., 3 and 4 (see that both of 3 and 4 occur with equal maximum frequency 4 ). A distribution is said to be unimodal, bimodal, or multimodal according as it has one, two, or more than two modes.
Table of Contents
Calculation of mode
In the case of a simple series, mode is that value of the variable which occurs the maximum number of times.
In case of a simple frequency distribution, mode is the value of the variable which has the maximum frequency.
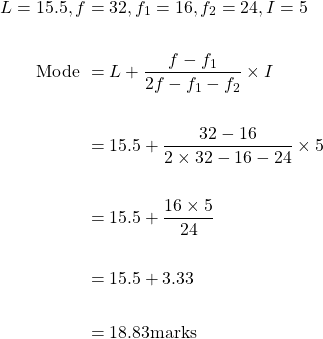
In case of a grouped frequency distribution, it is very difficult to determine mode accurately. A graphical method may be employed to find the value of mode. The abscissa corresponding to the peak of the frequency curve gives the value of mode. However, the following formula may be used to calculate mode from a grouped frequency distribution, provided all classes are of equal width :![]()
where, f1 = lower class boundary of the modal class i . e ., the class corresponding to the maximum frequency
f= frequency of the modal class
f1= frequency of the class just preceding the modal class
f2= frequency of the class just succeeding the modal class and
i= common width of class intervals. .
If the class intervals in a grouped frequency distribution are of unequal width, the following empirical relation between mean, median, and mode may be used to obtain an approximate value of mode :
Mode = 3 median – 2 Mean
Example
1. Find the mode of the following data
x | 1-5 | 6-10 | 11-15 | 16-20 | 21-25 | 26-30 | 31-35 | 36-40 | 41-45 |
f | 7 | 10 | 16 | 32 | 24 | 18 | 10 | 5 | 1 |
Here 16-20 is the model class because it contains the highest frequency.

Advantages
(1) Mode is very easy to understand.
2) Its determination does not involve many mathematical calculations. It can. be located merely by inspection in case of a discrete series or of a simple frequency distribution.
(3) It is not affected by the extreme values of the variable.
(4) It can be calculated very easily from grouped frequency distribution with open-end classes, provided it is known that all classes are of equal width.
(5) Like median, it can also be located by graphical method.
(6) It is the most typical value of distribution; hence, it is widely used in business and industry. Thus, it is the most appropriate average to be used to determine the ideal sizes of shoes, ready-made garments, etc.
Disadvantages
(1) Mode has no importance as a statistical average unless a large number of variable values is available.
(2) Mode is not rigidly defined. Its definition is meaningless if all values of the variable occur with equal frequency or, if the maximum frequency is repeated or if the maximum frequency occurs either in the very beginning or at the end of the distribution.
(3) It cannot be treated algebraically; hence, it is not suitable for application in further statistical analysis.
(4) Mode is affected to a great extent by the fluctuations of sampling.
(5) Its value is not based on all the values of the variable.
(6) It is very difficult to locate the value of mode accurately from a grouped frequency distribution with classes of unequal widths or with open-end classes.

Leave a Reply