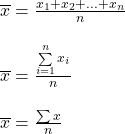
Arithmetic mean is a measure of central tendency of a set of values of a variable and is obtained by dividing the sum of the values of the variable by number of values included in the sum.
Mathematically, if x1, x2 , …, xn be the n values of a variable x and ![]() (read as x bar) their arithmetic mean, then by definition,
(read as x bar) their arithmetic mean, then by definition,
Table of Contents
Symbol of Arithmetic Mean
![]() (read as x bar)
(read as x bar)
Formulas of Arithmetic Mean
(a) Simple Arithmetic Mean

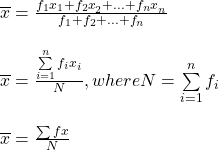
(b)Weighted Arithmetic Mean

(c)Arithmetic Mean of group data
To calculate the A.M. of grouped data of all observations are assumed to cluster at the mid-values(x) of the respective classes.

(d)Step divination method of Arithmetic Mean
When x’s are large numbers for simplicity of calculation, the variable of x changes to variable d,
![]()
![]()
A = change in origin or assume mean. The value of A is chosen as observation middle or near middle of the distribution.
I = change in scale. I is chosen as class width for class intervals of equal width or H.C.F. of the class width for class intervals of unequal width.
Important Properties of Arithmetic Mean
(a) The sum of the deviations of all observation from their mean zero.
Let a variable x assume n different values x1, x2, …, xn with respective frequencies f1, f2 …, fn then their A.M. is defined as
![]() …..(1)
…..(1)
Now, the sum of deviations of all these observations about mean is given by
![Rendered by QuickLaTeX.com \begin{aligned} D&=f_{1}\left(x_{1}-\bar{x}\right)+f_{2}\left(x_{2}-\bar{x}\right)+\ldots+f_{n}\left(x_{n}-\bar{x}\right) \\ &=\sum_{i=1}^{n} f_{i}\left(x_{i}-\bar{x}\right) \\ &=\sum f_{i} x_{i}-\sum f_{3} \bar{x} \\ &=N \bar{x}-\bar{x} \sum f ; \quad\left[\text { since from } \quad \text { (i) } \sum f ; x_{i}=N \bar{x}\right] \\ &=N \bar{x}-N \bar{x}\left[\text { since } \sum f_{i}=N\right]\\&=0 \end{aligned}](https://raynoc.com/wp-content/ql-cache/quicklatex.com-c3444aa5baa868149dc21fae8ba6ca89_l3.png)
(b) The sum of the squares of the deviations of all observation is minimum when the deviation is taken from their A.M.
Let a variable x assumes n different values x1, x2, …, xn with respective frequencies f1, f2 …, fn . Then their A.M. is defined as
![]()
Now, let us take the deviation of all the observations from an arbitrary number A . Therefore , the sum of the squares of the deviations of all these observations from A is given by
![]()
We have to prove that D will be minimum if A = ![]() . Now,
. Now,
![Rendered by QuickLaTeX.com \begin{array}{l} D = \sum{{f}_{i}}({x}_{i}{ - A)}^{2}\\ \\ D = \sum{{f}_{i}({x}_{i} - \overline{x}) + (\overline{x}{ - A)}^{2}}\\ \\ D = \sum{{f}_{i}[({x}_{i} - \overline{x}{)}^{2} + (\overline{x}{ - A)}^{2} + 2({x}_{i} - \overline{x})(\overline{x} - A)]}\\ \\ D = \sum{{f}_{i}}({x}_{i} - \overline{x}{)}^{2} + \sum{{f}_{i}(\overline{x}{ - A)}^{2} + \sum{{f}_{i}2({x}_{i} - \overline{x})(\overline{x} - A)}}\\ \\ D = \sum{{f}_{i}({x}_{i} - \overline{x}}{)}^{2} + (\overline{x}{ - A)}^{2} . \sum{{f}_{i} + 2(\overline{x} - A). \sum{{f}_{i}({x}_{i} - \overline{x}})}\\ \\ D = {f}_{i}({x}_{i} - \overline{x}) + (\overline{x}{ - A)}^{2} . N + 0 [Since \sum{{f}_{i}}({x}_{i} - \overline{x}) = 0]\end{array}](https://raynoc.com/wp-content/ql-cache/quicklatex.com-41b9c37392eadf4e0037b13549e97e23_l3.png)
Thus we find that D is equal to the sum of two non-negative terms of which the first one has a fixed value, therefore , D will be minimum. when second term is minimum , i.e., zero. This is possible when A = ![]() .
.
(c) If two variables x and y have relation y = ax + b (a and b are constants) and A.M. of x will be  , A.M. of y will be a
 + b
+ b
Let x1, x2, …, xn be the n values of x and their corresponding frequencies are f1, f2 …, fn. Since A.M. of x is ![]() hence,
hence,
![]()
Now, the variables x and y are connected by the relation y = ax + b ; therefore , if y1, y2, …, yn be the values of the y corresponding to the values x1, x2, …, xn of x then,
y1 = ax1 + b , y2 = ax2 + b , …, yn = axn + b
and the frequencies of these values are f1, f2, …, fn respectively.
If the A.M. of y be ![]() then by definition,
then by definition,
![Rendered by QuickLaTeX.com \begin{array}{l} \overline{y} = \frac{1}{N}[{f}_{1}{y}_{1} + {f}_{2}{y}_{2} + ... + {f}_{n}{y}_{n}]\\ \\ \overline{y} = \frac{1}{N}[{f}_{1}(a{x}_{1} + b) + {f}_{2}(a{x}_{2} + b) + ... + {f}_{n}(a{x}_{n} + b)]\\ \\ \overline{y} = \frac{1}{N}[a({f}_{1}{x}_{1} + {f}_{2}{x}_{2} + ... + {f}_{n}{x}_{n}) + b({f}_{1} + {f}_{2} +... +{f}_{n})]\\ \\ \overline{y} = \frac{1}{N}[a\sum{fx} + b\sum{f]}\\ \\ \overline{y} = \frac{1}{N}[a.N\overline{x} + bN]\\ \\ \overline{y} = a\overline{x} + b\end{array}](https://raynoc.com/wp-content/ql-cache/quicklatex.com-89a6282101366a9dc47bd1d0b9a4307a_l3.png)
How to Calculate Arithmetic Mean
Example
Height | 130-134 | 135-139 | 140-144 | 145-149 | 150-154 | 155-159 | 160-164 |
Frequency | 5 | 15 | 28 | 24 | 17 | 10 | 1 |
solution :
Class | f | Mid value (x) | d= (x - A)/I A =147; I = 5 | fd |
130-134 | 5 | 132 | -3 | -15 |
135-139 | 15 | 137 | -2 | -30 |
140-144 | 28 | 142 | -1 | -28 |
145-149 | 24 | 147 | 0 | 0 |
150-154 | 17 | 152 | 1 | 17 |
155-159 | 10 | 157 | 2 | 20 |
160-164 | 1 | 162 | 3 | 3 |
Total | 100 | -33 |
![]()
Mean of Composite Group
Let there be two groups having number of observation n1 and n2 an A.M. s ![]() and
and ![]() .
.
Then the composite A.M. ![]() of these groups is given by
of these groups is given by
![]() .
.
For three groups, the formula is
![]()
Example :
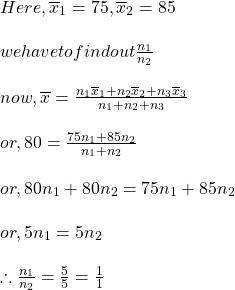
The avg marks obtained in an examination by two groups of students were found to be 75 and 85 respectively. determine the ratio of students in the two groups, if the avg marks for all the students was 80.
Solution:

the require of the students in the two groups is 1 : 1
Advantages and Disadvantages of Arithmetic Mean:
Arithmetic mean fulfills all the criteria to be a good statistical average. For this reason, it is widely being used and it is an ideal measure of central tendency.
Advantages:
(1) It is easy to understand and does not require any explanation
(2) It is easy to calculate A.M te., its computation does not involve laborious numerical calculations.
(3) It is rigidly defined; hence its value is independent of the bias of the enumerator In fact, it always possesses a definite value.
(4) It takes into consideration all the observations of a series and hence, may be regarded as the representative of the series.
(5) Arithmetic mean is easily amenable to algebraic treatment. For this reason, it has very wide application in further statistical analysis.
(6) It can be computed if merely the number of observations and their sum is known.
(7) Computation of A.M. does not require arraying of numerical data.
(8) It provides a good basis for comparison.
(9) If the A.M. and the number of observations in each of a finite number of groups be given, then the groups can be algebraically combined to obtain the A.M. of the composite group.
(10) It is least affected by sampling fluctuations. In this respect, it is the most stable average of all the statistical averages.
Disadvantages
(1) A.M. cannot be determined by inspection, as in the case of median or mode.
(2) A.M, is termed as a fictitious average because its value may not be an actual value of the variable.
(3) The greatest disadvantage of A.M. is that it is very much affected by one or two extremely large or small values of the variable.
(4) It is not possible to compute the value of A. if some values in the series are missing.
(5) It is not possible to compute the value of A.M. from a frequency distribution with open-end classes unless some assumptions are made regarding the sizes of these classes.
(6) It cannot be located graphically.

Leave a Reply